Deployment Frequency is a software delivery metric popularised in the book Accelerate (2018). It measures the number of times a software component is deployed to production. I work on an Engineering Insights system at a BigTech company. Deployment Frequency is one of the metrics we measure and provide for teams to use and drive improvement. Through my experience in developing and operating the Engineering Insights system I’ve learned a lot about Deployment Frequency. Here I share my philosophy on the metric and sketch out how you can use it effectively.
Deployment Frequency, DevOps Capabilities
Deployment Frequency (DF) is the average number of deployments per day over a given timespan. For example,
- 5 deployments over 7 days, DF = 0.7
- 20 deployments over 21 days, DF = 0.95
- 3 days deployments over 1 day, DF = 3
I view Deployment Frequency as a lens into whether a given piece of software can be deployed on-demand. Being able to deploy on-demand is a DevOps superpower. This simple-to-say capability means the team has maturity and trust in their software delivery practices, systems they deploy, automated test suite, reliability of the deployment pipeline, maturity of monitoring, understanding of regulation and compliance, and much more. I call it a DevOps superpower because if teams can do this, they collectively save tens of hours per week otherwise spent on deployment-related work.
An oversimplified and perhaps Platonic example, an engineer makes a change to a codebase. What’s stopping them immediately deploying it to production? Speaking from experience there is always a reason not to:
- Time - There’s more valuable things to do than watch the deployment pipeline.
- Quality of the Pipeline - Can the engineer click ‘Deploy’ and walk away? Or do they need to babysit the deployment to respond to common failures.
- Monitoring and QA - Once the deployment is finished is the engineer expected to verify the deployed system? Is there automated monitoring in place? Do they trust it?
- Trust in the overall system - Afraid that something will go wrong. “We don’t deploy after 3pm”.
- Organisational rules & culture - Risk aversion to code changes around earnings calls, press, “We don’t deploy during our customer’s critical hours”.
- Someone else will deploy it - Often seen in shared codebases. Shows a lack of autonomy or capability.
To continually improve and mature our DevOps Capabilities, we seek to remove those reasons not to deploy. As deployments take less of an engineer’s time and worry, we expect to see the Deployment Frequency increase. Our end goal is to achieve Zero-cost Deployments .
By itself, the Deployment Frequency number tells us next to nothing. We get more signal when viewing the trend of Deployment Frequency over the last few months. This gives insight into the ‘business as usual’ deployment pattern of the software. For even more context, view Deployment Frequency alongside the Delivery Lead Time and SLO & SLI metrics.
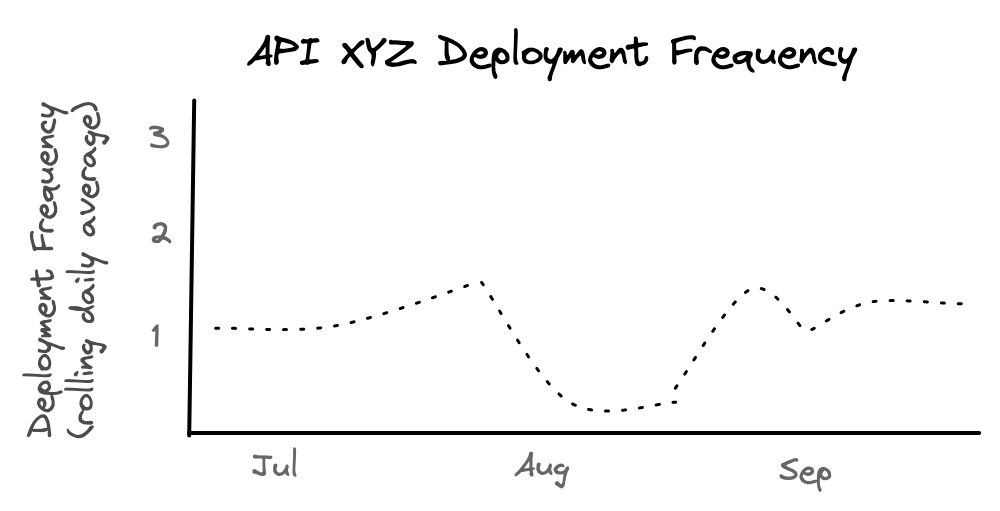
Viewing the DF trend reveals the norm, and allows us to ask questions when it drifts away.
Accelerate, Lean, Batch Size
Accelerate (2018) lists Deployment Frequency as one of the four key metrics to measure DevOps performance. It frames Deployment Frequency not in the context of DevOps Capabilities and Deployments (like I do above), but in the context of the Lean Methodology. Accelerate focuses on Batch Size. Keeping Batch Size small is supposed to contribute to flow, faster feedback, and less variability in delivery.
However, in software, batch size is hard to measure and communicate across contexts as there is no visible inventory. Therefore, we settled on deployment frequency as a proxy for batch size since it is easy to measure and typically has low variability.
Accelerate (2018) p50
The author’s take is that Deployment Frequency is an indicator for how teams batch work. I question whether it’s an effective proxy, but it does complement the frame I proposed above. The ‘reasons to not deploy’ exhibits itself in batched work. I’ve worked in shared code bases that were full of flakey tests. The project was generally accepted as being difficult to deploy, and teams would batch changes so that they didn’t have to be the one to initiate a deployment.
The Batch Size frame is another way of looking at the costs of a deployment. If deploying code is sufficiently difficult, stressful, or costly (typically time), then engineers are incentivised to delay it and batch changes.
A Simple Model to Think About Deployment Frequency
Here’s a simple model I use to think about Deployment Frequency. The weights on each contributing factor differ between teams and technologies being used.
Deployment Frequency = Activity * Engineering Practices * Deployment Aspects
Activity - the number of engineer-hours spent working on the component.
Engineering Practices - Contributing factors when code is being written.
- Pure trunk based development vs Pull requests
- Batching of commits
- Cost of testing locally (if it’s difficult to test, changes get batched)
- Code review practices
- Continuous integration
Deployment Aspects - Contributing factors after code is written.
- Continuous deployment
- Use of feature flags
- Requirement for manual testing
- Quality of the build pipeline, and one’s confidence in it
- Quality of automated tests
The factors that contribute to Deployment Frequency (DF) are very similar to Delivery Lead Time (DLT) . Team and technology practices are both key determiners of DF and DLT. Activity, however, applies only to Deployment Frequency. We expect a codebase with many teams working in it to have a higher DF than a small microservice owned by a single team. We expect components actively being worked on to have a higher DF than other components. DLTs may not vary across those projects.
This Activity factor brings DF into the realm of ‘output metrics’ such as lines of code written, numbers of PRs, or number of tickets completed. For this we must be careful! The fact that Activity can distort the metric so much means that the DF number is only relevant to those who have specific context of the project.
Deployment Frequency in the Real World
We want teams to be able to deploy code on demand. For this they need to have a deployment process that is low cost. What signal does the Deployment Frequency metric give to this? It’s not clear at all. Even having a high deployment frequency is not always a good thing. Context matters.
Consider a microservices system with 10 deployable components, a mixture of lambdas, queues, workers, and frontends. A single team owns and works on these. In any given week the set of components the team works on changes. Typically they work on the API and SPA components, but occasionally they’ll add some new message types to the queues and workers, and update them to the latest versions of libraries. In microservices architectures the Deployment Frequency of an individual component may not be representative of that of the entire system. In this scenario I see the aggregate DF of all 10 components as the valuable metric to track, the individual DFs not so much.
Take a scenario where there’s a large monolithic codebase that 7 teams operate in. On average this system is deployed to production 3 times per day. Without knowing any context of the system, if we were to see ‘Deployment Frequency of 3’ on a dashboard, our first thought may be that things are in a good state. A high Deployment Frequency metric shows that the component has mature Engineering Practices and Deployment Aspects. Looking deeper, we see there’s a release calendar for the system booked out weeks in advance and that deployments take 3 hours to complete. The reality is that teams operating in this codebase are being held back - they want to, but are unable to, deploy more frequently. Here the Deployment Aspects and Activity factors are limiting the ability for teams to deliver.
These two examples demonstrate the importance of abstraction and context when seeing to understand the Deployment Frequency metric. Teams, who are experts in their systems, must set a DF target. There is no objective good Deployment Frequency number to aim for.
It’s important to note that Deployment Frequency is a metric we don’t want to blindly increase. Take the second scenario with the monolithic codebase. Removing the deployment bottleneck could be done in a couple of ways.
- Reduce the time it takes to deploy, so more deployments can be done. This is done by investing in the Engineering Practices and Deployment Aspects of the codebase.
- Reduce the activity in the codebase, so fewer deployments need to be made. This is done by refactoring systems out of the monolith allowing teams to operate autonomously.
In some situations it’s a fine goal to want to reduce Deployment Frequency. The end goal is that teams, whatever situation, can deploy code to production whenever they want.
Time Since Last Deployment
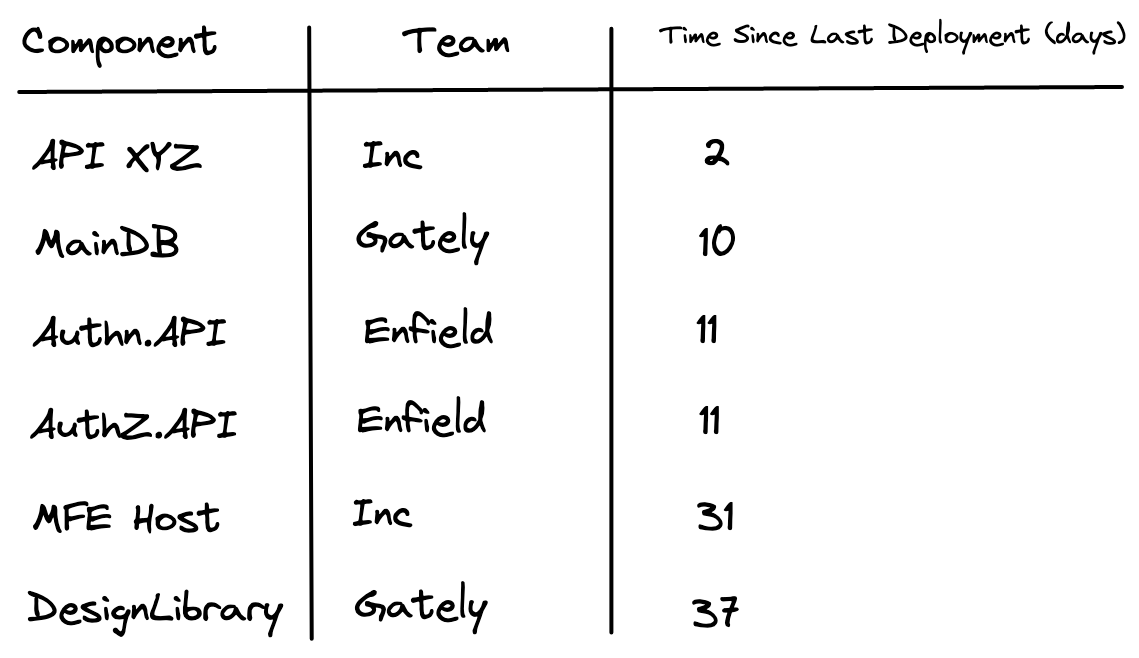
Time Since Last Deployment (TSLD) is a metric that can be calculated from the same dataset that is used for DF. It’s incredibly simple, how many days ago was the component last deployed to production?
Time Since Last Deployment
A low TSLD tells us that a component was recently deployed. The real value of TSLD is in revealing components that have not been deployed for some time. For internet-facing systems this is especially important. When we see that a component was last deployed 90 days ago we can start asking questions around ownership of the component, whether it’s being maintained, and whether it’s up to date with security patches.
Context matters. Not all software needs to be regularly deployed and that’s OK. In a startup I’ve worked at we owned few systems that were all actively worked on. Using TSLD there would have been a waste of time. Contrast this to BigTech where there are hundreds of engineering teams working on thousands of software components. Software ownership can fall through the cracks, and seeing a component with a high TSLD is incredibly valuable.
Deployment Frequency Prompts
Like other metrics, Deployment Frequency should be used within teams to start conversations. The goal of these conversations is to share knowledge and identify areas to improve. Here are a few prompts for starting conversations around Deployment Frequency (and deployment maturity in general) in your team.
- How often do we want to deploy the components we work on?
- Calculate how much time the team collectively spends doing code deployments per week.
- Is code deployed only when a feature is complete, or as it’s developed? By deploying iteratively we get faster feedback and save time on merge conflicts.
- How can we utilise feature flags to decouple deployments from releases?
- Do we have a release calendar? Do we have a plan to change the project so we no longer need the release calendar?
- Ask every engineer what their biggest concern in deploying code is. How can we improve it?
- Ask every engineer to note down when they thought about doing a deployment but chose not to. What can we learn from this?
- What do other teams’ deployment processes look like? What can we adopt from them?
- Share a graph showing average Deployment Frequency per day over the last 3 months is presented. The team walks through it week by week talking about aspects of it. Eg “These two weeks DF dipped because we had 3 team members on holiday”, “This week DF peaked because we were approaching the production launch” etc.